1
2
3
4
5
6
7
8
9
10
11
12
13
14
15
16
17
18
19
20
21
22
23
24
25
26
27
28
29
30
31
32
33
34
35
36
37
38
39
40
41
42
43
44
45
46
47
48
49
50
51
52
53
54
55
56
57
58
59
60
61
62
63
64
65
66
67
68
69
70
71
72
73
74
75
76
77
78
79
80
81
82
83
84
85
86
87
88
89
90
91
92
93
94
95
96
97
98
99
100
101
102
103
104
105
106
107
108
109
110
111
112
113
114
115
116
117
118
119
120
121
122
123
124
125
126
127
128
129
130
131
132
133
134
135
136
137
138
| function magnify(f1)
%
%magnify(f1)
%
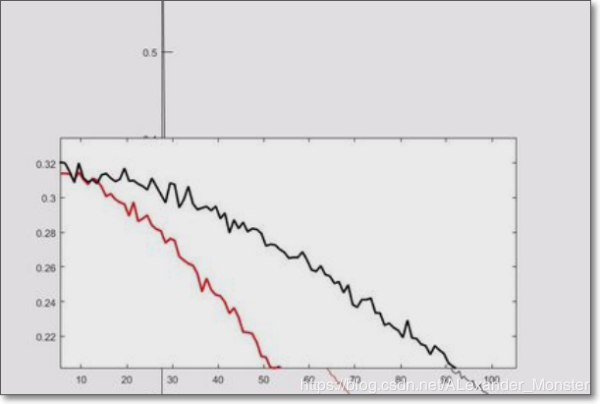
% Figure creates a magnification box when under the mouse
% position when a button is pressed. Press '+'/'-' while
% button pressed to increase/decrease magnification. Press
% '>'/'<' while button pressed to increase/decrease box size.
% Hold 'Ctrl' while clicking to leave magnification on figure.
%
% Example:
% plot(1:100,randn(1,100),(1:300)/3,rand(1,300)), grid on,
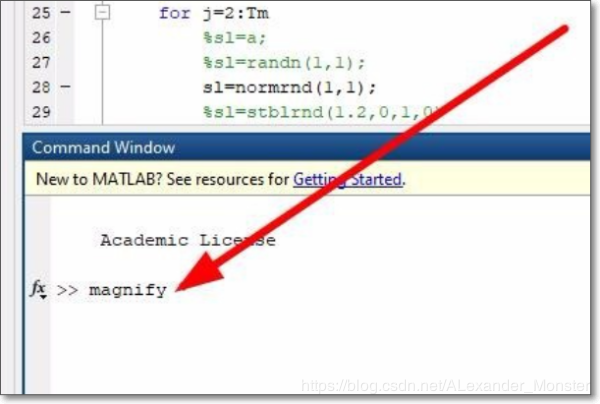
% magnify;
% Rick Hindman - 7/29/04
if (nargin == 0), f1 = gcf; end;
set(f1, ...
'WindowButtonDownFcn', @ButtonDownCallback, ...
'WindowButtonUpFcn', @ButtonUpCallback, ...
'WindowButtonMotionFcn', @ButtonMotionCallback, ...
'KeyPressFcn', @KeyPressCallback);
return;
function ButtonDownCallback(src,eventdata)
f1 = src;
a1 = get(f1,'CurrentAxes');
a2 = copyobj(a1,f1);
set(f1, ...
'UserData',[f1,a1,a2], ...
'Pointer','fullcrosshair', ...
'CurrentAxes',a2);
set(a2, ...
'UserData',[2,0.2], ... %magnification, frame size
'Color',get(a1,'Color'), ...
'Box','on');
xlabel(''); ylabel(''); zlabel(''); title('');
set(get(a2,'Children'), ...
'LineWidth', 2);
set(a1, ...
'Color',get(a1,'Color')*0.95);
set(f1, ...
'CurrentAxes',a1);
ButtonMotionCallback(src);
return;
function ButtonUpCallback(src,eventdata)
H = get(src,'UserData');
f1 = H(1); a1 = H(2); a2 = H(3);
set(a1, ...
'Color',get(a2,'Color'));
set(f1, ...
'UserData',[], ...
'Pointer','arrow', ...
'CurrentAxes',a1);
if ~strcmp(get(f1,'SelectionType'),'alt'),
delete(a2);
end;
return;
function ButtonMotionCallback(src,eventdata)
H = get(src,'UserData');
if ~isempty(H)
f1 = H(1); a1 = H(2); a2 = H(3);
a2_param = get(a2,'UserData');
f_pos = get(f1,'Position');
a1_pos = get(a1,'Position');
[f_cp, a1_cp] = pointer2d(f1,a1);
set(a2,'Position',[(f_cp./f_pos(3:4)) 0 0]+a2_param(2)*a1_pos(3)*[-1 -1 2 2]);
a2_pos = get(a2,'Position');
set(a2,'XLim',a1_cp(1)+(1/a2_param(1))*(a2_pos(3)/a1_pos(3))*diff(get(a1,'XLim'))*[-0.5 0.5]);
set(a2,'YLim',a1_cp(2)+(1/a2_param(1))*(a2_pos(4)/a1_pos(4))*diff(get(a1,'YLim'))*[-0.5 0.5]);
end;
return;
function KeyPressCallback(src,eventdata)
H = get(gcf,'UserData');
if ~isempty(H)
f1 = H(1); a1 = H(2); a2 = H(3);
a2_param = get(a2,'UserData');
if (strcmp(get(f1,'CurrentCharacter'),'+') | strcmp(get(f1,'CurrentCharacter'),'='))
a2_param(1) = a2_param(1)*1.2;
elseif (strcmp(get(f1,'CurrentCharacter'),'-') | strcmp(get(f1,'CurrentCharacter'),'_'))
a2_param(1) = a2_param(1)/1.2;
elseif (strcmp(get(f1,'CurrentCharacter'),'<') | strcmp(get(f1,'CurrentCharacter'),','))
a2_param(2) = a2_param(2)/1.2;
elseif (strcmp(get(f1,'CurrentCharacter'),'>') | strcmp(get(f1,'CurrentCharacter'),'.'))
a2_param(2) = a2_param(2)*1.2;
end;
set(a2,'UserData',a2_param);
ButtonMotionCallback(src);
end;
return;
% Included for completeness (usually in own file)
function [fig_pointer_pos, axes_pointer_val] = pointer2d(fig_hndl,axes_hndl)
%
%pointer2d(fig_hndl,axes_hndl)
%
% Returns the coordinates of the pointer (in pixels)
% in the desired figure (fig_hndl) and the coordinates
% in the desired axis (axes coordinates)
%
% Example:
% figure(1),
% hold on,
% for i = 1:1000,
% [figp,axp]=pointer2d;
% plot(axp(1),axp(2),'.','EraseMode','none');
% drawnow;
% end;
% hold off
% Rick Hindman - 4/18/01
if (nargin == 0), fig_hndl = gcf; axes_hndl = gca; end;
if (nargin == 1), axes_hndl = get(fig_hndl,'CurrentAxes'); end;
set(fig_hndl,'Units','pixels');
pointer_pos = get(0,'PointerLocation'); %pixels {0,0} lower left
fig_pos = get(fig_hndl,'Position'); %pixels {l,b,w,h}
fig_pointer_pos = pointer_pos - fig_pos([1,2]);
set(fig_hndl,'CurrentPoint',fig_pointer_pos);
if (isempty(axes_hndl)),
axes_pointer_val = [];
elseif (nargout == 2),
axes_pointer_line = get(axes_hndl,'CurrentPoint');
axes_pointer_val = sum(axes_pointer_line)/2;
end;
|